You have been diligently working with large datasets in Excel, striving for accuracy and efficiency. What if there were expert tips that could take your data formatting skills to the next level? Imagine the impact on your productivity and the insights you could uncover. From advanced filtering techniques to powerful data manipulation tools, these tips have the potential to revolutionize your approach to data formatting. Are you curious to discover how these strategies on Excel data formatting for large datasets could transform your Excel experience?
Data Sorting Techniques
When dealing with large datasets in Excel, mastering data sorting techniques is crucial for efficient analysis and organization. Advanced filtering and data cleaning are essential components of this process. Advanced filtering allows you to set specific criteria to display only the data that meets those conditions. This feature is particularly useful when dealing with extensive datasets, as it enables you to focus on relevant information quickly. Data cleaning involves identifying and correcting errors or inconsistencies in the dataset. By cleaning the data, you ensure accuracy and reliability in your analysis.
To utilize data sorting effectively, start by selecting the dataset you want to organize. Then, navigate to the “Data” tab and choose the “Sort” option. Here, you can specify the criteria for sorting the data, such as alphabetically, numerically, or by date. Additionally, you can set up multiple levels of sorting to further refine the organization of your data. By mastering these data sorting techniques, you can streamline your analysis process and gain valuable insights from your datasets.
Data Filtering Methods
To effectively manage and analyze vast amounts of data in Excel, mastering data sorting techniques plays a pivotal role in organizing information for efficient processing. When it comes to Data Filtering Methods, understanding data cleansing strategies and advanced filtering techniques is crucial for refining your datasets effectively. Here are some key points to consider:
- Utilize Data Cleansing Strategies: Before applying filters, ensure your data is clean and free of errors. Use tools like data validation and text-to-columns to standardize formats and remove inconsistencies.
- Leverage Advanced Filtering Techniques: Excel offers advanced filtering options such as filter by color, filter by criteria, and custom filters. These tools enable you to narrow down your dataset based on specific conditions and criteria.
- Combine Filters for Complex Analysis: To perform in-depth analysis, consider combining multiple filters to extract precise information from your data, allowing you to uncover valuable insights efficiently.
Using Power Query
For efficient data manipulation and transformation within Excel, utilizing Power Query can significantly enhance your workflow. Power Query is a powerful tool that enables you to streamline the process of data transformation and cleansing in large datasets. With Power Query, you can easily import, merge, and shape data from various sources to meet your specific requirements.
When it comes to data transformation, Power Query offers a wide range of functionalities such as splitting columns, removing duplicates, and aggregating data. These features allow you to clean and restructure your data efficiently, saving you valuable time and effort. Additionally, Power Query provides a user-friendly interface that makes it easy to perform complex data transformations with just a few clicks.
Furthermore, Power Query enables you to automate the data cleansing process by creating reusable queries that can be refreshed with a single click. This ensures that your data is always up-to-date and accurate, enhancing the overall quality of your analysis and reporting. By leveraging Power Query for data transformation and cleansing, you can optimize your Excel workflow and work more effectively with large datasets.
Conditional Formatting
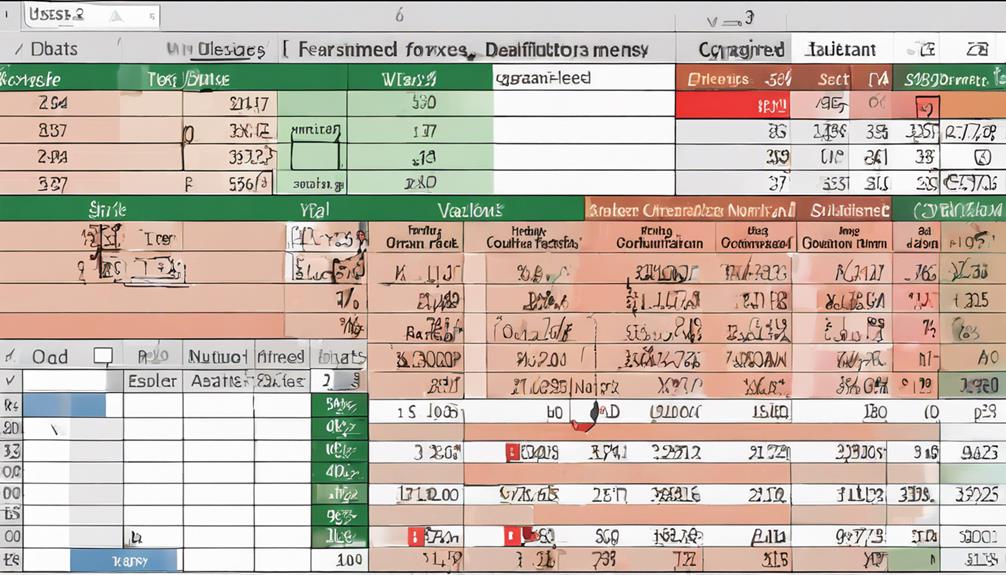
Conditional formatting in Excel allows you to visually highlight important trends or outliers within your dataset by assigning specific colors to data points based on criteria you set. This color-coded data visualization makes it easier to spot patterns and anomalies at a glance, enhancing your data analysis process. Additionally, with dynamic rule application, you can set conditions that automatically adjust as your dataset changes, ensuring your formatting remains up to date and relevant.
Color-Coded Data Visualization
Color-Coded Data Visualization through Conditional Formatting offers a powerful tool for efficiently interpreting large datasets in Excel. By using color to represent different data values, you can quickly identify patterns, trends, and outliers within your dataset. Here are three key advantages of color-coded data visualization:
- Heat map visualization: Utilize a heat map to visually represent data using a spectrum of colors. This method is effective for highlighting variations in data intensity, making it easy to spot high and low values at a glance.
- Data bar formatting: Data bars provide a visual representation of the cell value compared to others in the selected range. This allows for a quick comparison of values within a dataset, making it easier to identify the relative size or magnitude of each data point.
- Customized color scales: Tailor the color scale to suit your specific dataset and objectives. By customizing the color scheme, you can emphasize certain data ranges or categories, enhancing the clarity and impact of your visualizations.
Dynamic Rule Application
With the ability to dynamically apply rules through Conditional Formatting in Excel, you can further enhance the visual representation of your data. Automated formatting becomes effortless as you set up dynamic formatting rules that adjust based on the values in your dataset. By using Conditional Formatting, you can highlight specific trends or outliers instantly, making it easier to spot crucial information within your large dataset. Excel allows you to create rules that automatically change the formatting of cells based on conditions you specify. This means that as your data changes or updates, the formatting will adjust accordingly, saving you time and ensuring consistency in your data visualization. Dynamic rule application through Conditional Formatting provides a flexible and efficient way to manage the appearance of your data, ensuring that important insights are easily accessible at a glance. By utilizing these features, you can streamline the process of analyzing and interpreting large datasets with precision.
Data Validation
How can you ensure the accuracy and consistency of your data in Excel? When it comes to handling large datasets, data validation is crucial for maintaining data integrity. By implementing validation rules, you can prevent errors and ensure that your data meets specific criteria. Here are some key strategies to enhance your data validation process:
- Set up Data Audit Trails: Create a log to track changes made to the dataset, allowing you to review and verify alterations for accuracy.
- Implement Data Cleansing Techniques: Use tools like Excel functions or add-ins to identify and correct errors, duplicates, or inconsistencies within your dataset.
- Define Validation Rules: Establish rules to validate data entries, such as range checks, list validations, or date constraints, ensuring that only accurate data is entered.
Text to Columns
To separate text into different columns based on a delimiter or a fixed width, Excel provides a powerful feature known as Text to Columns. This feature is invaluable for text manipulation and data segmentation within large datasets. When dealing with data that needs to be split into separate columns based on a specific character or pattern, Text to Columns is the go-to tool.
By utilizing Text to Columns, you can easily segment data that is currently in one column into multiple columns, saving you time and effort. Whether you need to separate first and last names, split addresses into street, city, and zip code, or divide a single cell with multiple values, this feature simplifies the process of organizing your data effectively.
Text to Columns allows you to choose the delimiter or specify a fixed width for segmentation, giving you control over how your data is split. This level of flexibility makes handling large datasets more manageable and enhances the accuracy of your data manipulation tasks.
Removing Duplicates
When working with large datasets in Excel, removing duplicates is crucial to maintain data accuracy and integrity. By identifying duplicate entries, you can ensure your dataset remains clean and reliable. Utilize Excel’s built-in tools to efficiently remove duplicates and establish a streamlined dataset, while also implementing preventive measures to avoid future duplicates from occurring.
Identifying Duplicate Entries
Identifying and removing duplicate entries is a crucial task when working with large datasets in Excel. To effectively manage duplicates, consider the following:
- Advanced Filtering Techniques: Utilize Excel’s advanced filtering options to easily identify duplicate entries within your dataset. By setting up custom filters, you can quickly isolate and review duplicate records without altering your original data.
- Data Scrubbing Methods: Implement data scrubbing techniques to clean your dataset and identify duplicates accurately. This process involves removing unnecessary spaces, correcting typos, and standardizing data formats to ensure efficient duplicate identification.
- Conditional Formatting: Apply conditional formatting rules to highlight duplicate entries visually. This feature allows you to color-code duplicate cells, making it easier to spot and manage duplicate values within your dataset.
Using Excel’s Tools
For efficiently managing duplicate entries in your large dataset, utilizing Excel’s built-in tools for removing duplicates is a straightforward and effective approach. Data organization is crucial for maintaining the integrity of your dataset. To access Excel’s duplicate removal tool, select the range of data where you want to remove duplicates. Go to the “Data” tab on the Excel ribbon, then click on “Remove Duplicates” in the Data Tools group. A dialog box will appear, allowing you to choose the columns where Excel should look for duplicates. This tool enhances formatting efficiency by quickly identifying and eliminating redundant entries. Excel will keep only unique values based on your selection criteria. It is important to review the results to ensure that the right duplicates were removed. By using Excel’s built-in tools for removing duplicates, you can streamline your data organization process and maintain a clean dataset for further analysis and reporting.
Preventing Future Duplicates
To prevent future duplicates in your dataset, implementing strategies to proactively remove redundant entries can significantly enhance the overall data quality and streamline your data management process. Utilize the following strategies to effectively prevent future duplicates:
- Regular Data Audits: Conduct routine checks on your dataset to identify and rectify any duplicate entries promptly.
- Use Conditional Formatting: Apply Excel’s conditional formatting feature to highlight potential duplicates automatically, making them easier to spot and remove.
- Utilize Excel Functions: Leverage Excel functions like COUNTIF and VLOOKUP to detect duplicate entries based on specific criteria and take necessary actions to prevent them from occurring in the future.
Date and Time Formatting
When working with large datasets in Excel, mastering the art of date and time formatting is crucial for accurate analysis and presentation of information. To ensure precision, consider time zone adjustments. Excel allows you to convert timestamps to different time zones easily. By applying the correct time zone to your data, you can standardize information and avoid confusion when working with collaborators in different regions. Additionally, date range calculations are essential for deriving insights from your dataset. Excel offers various functions like DATEDIF and NETWORKDAYS to calculate the duration between two dates or the number of working days within a specific period. These calculations are valuable for tracking project timelines, analyzing trends, and making informed decisions based on time-based data. By mastering date and time formatting techniques, you can enhance the accuracy and efficiency of your data analysis process in Excel.
Number Formatting
Number formatting in Excel is a fundamental aspect of organizing and presenting numerical data effectively. When dealing with large datasets, it is crucial to pay attention to the following key points:
- Currency Formatting: Utilize currency formatting to display monetary values in a clear and consistent manner. This helps in enhancing the readability of financial data and making it easier for stakeholders to interpret.
- Decimal Precision: Adjust the decimal precision to the appropriate level to ensure accuracy and avoid rounding errors. This is particularly important when working with complex calculations or financial figures where precision is paramount.
- Percentage Formatting: Use percentage formatting to represent values as percentages, making it simpler to compare data across different categories. This can be beneficial when analyzing trends or distributions within the dataset.
Cell Merging
In organizing and presenting numerical data effectively in Excel, one important aspect to consider is cell merging. Cell merging allows for advanced customization and efficient organization of data within a spreadsheet. By merging cells, you can combine multiple adjacent cells into one larger cell, providing a cleaner and more visually appealing layout for your data. This feature is particularly useful when creating headers or titles that span across several columns or rows.
To merge cells in Excel, select the cells you want to merge, right-click, and choose “Merge & Center” from the dropdown menu. You can also access this option from the Home tab on the ribbon. Additionally, you can choose to merge cells across, down, or merge all cells in the selection. Remember that once cells are merged, the content will only appear in the upper-left cell of the original selection.
Formatting With Macros/Vba
When dealing with large datasets in Excel, utilizing Macros/VBA can significantly enhance your efficiency by automating repetitive formatting tasks. Through Macros/VBA, you can customize formatting rules to suit the specific requirements of your dataset, saving you time and ensuring consistency in your formatting. This powerful tool allows you to streamline the formatting process and maintain a structured and organized dataset effortlessly.
Automating Formatting Tasks
To streamline and expedite the process of formatting large datasets in Excel, utilizing macros and VBA (Visual Basic for Applications) can be incredibly beneficial. By automating formatting tasks, you can save time and ensure consistency across your data. Here are some key benefits of using macros and VBA for data formatting:
- Batch formatting automation: With macros and VBA, you can apply the same formatting rules to multiple sheets or workbooks simultaneously, saving you the effort of manually formatting each one.
- Custom formatting templates: Create personalized formatting templates using macros and VBA to standardize the look and feel of your data based on your specific requirements.
- Efficiency and accuracy: Automating formatting tasks reduces the chance of human error and ensures that your data is formatted correctly every time.
Customizing Formatting Rules
For enhanced control and precision in data formatting within Excel, delving into the realm of customizing formatting rules through macros and VBA can be a game-changer. When customizing formatting rules, one powerful technique is highlighting outliers. By setting up conditional formatting strategies using macros or VBA, you can automatically flag data points that deviate significantly from the norm. This allows you to quickly identify and investigate potential errors or anomalies in your dataset.
To achieve this, you can create custom VBA scripts that analyze your data based on specific criteria you define. For example, you could highlight any values that are more than two standard deviations away from the mean or any values that fall outside a certain predefined range. This level of customization not only saves time but also ensures that your data is accurately and consistently formatted according to your unique requirements. By mastering these techniques, you can streamline your data analysis process and make more informed decisions based on reliable information.
Frequently Asked Questions
How Can I Protect My Excel Data From Accidental Changes?
To protect your Excel data from changes, you can use data validation to set rules for input accuracy. Additionally, enable password protection to restrict unauthorized alterations. These measures ensure the integrity and security of your information.
What Are Some Best Practices for Naming Ranges in Excel?
When organizing ranges in Excel, use clear naming conventions. Name ranges based on content or purpose for easy identification. Create a logical structure to streamline data management. Consistent naming improves efficiency and clarity.
Can Excel Handle Large Datasets Without Slowing Down?
Sure, Excel can handle large datasets without slowing down if you optimize performance. Utilize data filtering to manage information efficiently. By following these steps, you can ensure smooth operation even with extensive data sets.
Is There a Way to Automate Data Formatting Tasks in Excel?
Yes, you can automate formatting tasks in Excel by utilizing tools like macros and conditional formatting. Data validation techniques can enhance accuracy. By automating formatting, you save time and ensure consistency across large datasets.
How Can I Create Custom Data Formatting Rules in Excel?
You can customize conditional formatting in Excel by defining rules based on specific criteria. Use advanced data validation techniques to enhance accuracy. This empowers you to tailor formatting rules to meet your unique data visualization needs efficiently.


